
Concept explainers
Videos
In the active region, the output voltage
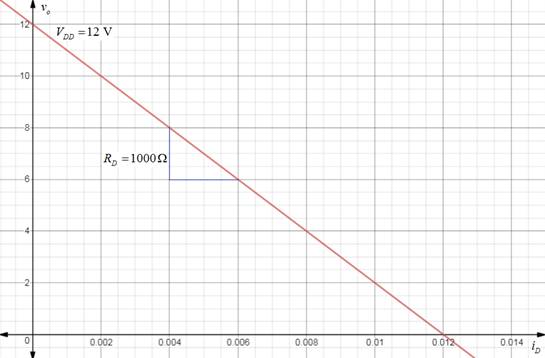
the values of me output voltage tor two different values of the drain current. Plot the output voltage
Want to see the full answer?
Check out a sample textbook solution
Chapter 1 Solutions
Introductory Mathematics for Engineering Applications
Additional Math Textbook Solutions
Basic Technical Mathematics
Fundamentals of Differential Equations (9th Edition)
Advanced Engineering Mathematics
Elementary Statistics Using Excel (6th Edition)
Precalculus Enhanced with Graphing Utilities


- A stamped sheet steel plate is shown in Figure 164. Compute dimensions AF to 3 decimal places. All dimensions are in inches. A=_B=_C=_D=_E=_F=_arrow_forwarduse the map in Figure 11.2. a Find the grid section of Taylor Hall. b. What is located in section 3B?arrow_forwardRepeat Example 5 when microphone A receives the sound 4 seconds before microphone B.arrow_forward
- The output of a solar panel (photovoltaic) system depends on its size. A manufacturer states that the average daily production of its 1.5 kW system is 6.6 kilowatt hours (kWh) for Perth conditions. A consumer group monitored this 1.5 kW system in 20 different Perth homes and measured the average daily production by the systems in these homes over a one month period during October. The data is provided here. kWh 6.2, 5.8, 5.9, 6.1, 6.4, 6.3, 6.9, 5.5, 7.4, 6.7, 6.3, 6.2, 7.1, 6.8, 5.9, 5.4, 7.2, 6.7, 5.8, 6.9 1. Analyse the consumer group’s data to test if the manufacturer’s claim of an average of 6.6 kWh per day is reasonable. State appropriate hypotheses, assumptions and decision rule at α = 0.10. What conclusions would you report to the consumer group? (Hint: You will need to find Descriptive Statistics first.) 2. If 48 homes in the central Australian city of Alice Springs had this system installed and similar data was collected, in order to assess whether average daily production in…arrow_forwardIn an experiment to assess the effect of the angle of pull on the force required to cause separation in electrical connectors, four different angles (factor A) were used, and each of a sample of five connectors (factor B) was pulled once at each angle. The data appears in the accompanying table. A 0° 20 4° 6° Ho: B1 = B₂ = ß3 =B4 = ß5 = 0 H₂: no B₁ = 0 Source ⒸH₂: α₁ = α₂ = x3 = α4 = 0 H₂: no α₁ = 0 0 Ho: a1 = 02 = az = 04 = 0 H: at least one a, # 0 A B Error Total 1 45.2 44.3 42.5 43.9 Does the data suggest that true average separation force is affected by the angle of pull? State the appropriate hypotheses. Ho: P₁ = B₂ = B3 =B4 = ß5 = 0 H₂: at least one ß, * 0 df 2 42.2 44.5 42.5 45.9 Test the hypotheses at level 0.01 by first constructing an ANOVA table (SST= 397.02, SSA= 54.44, and SSB 250.80). (Round your answers to two decimal places.) F0.01 SS B 3 39.7 38.5 42.5 47.6 MS 4 36.7 38.0 42.4 37.5 f 5 45.8 47.5 48.7 56.3 State the conclusion in the problem context. Reject H. The data…arrow_forwardAs people age they begin to experience hearing loss. A study was done to determine the 'comfort level' of sound for people of different ages. The data are given below: Age (years) Comfort Level (decibels) 15 25 35 45 55 65 75 85 56 57 64 64 68 74 78 85 Note: Σx 400 , Σy-546 , Σ-24200, ΣΥ-37986 , Σw-29010 a) Calculate the linear correlatior coefficient, r. b) Calculate the line-of-best-fit (linear prediction line.) c) If a person is 60 years of age, what do you predict the 'comfort level' of sound would be?arrow_forward
 Algebra & Trigonometry with Analytic GeometryAlgebraISBN:9781133382119Author:SwokowskiPublisher:Cengage
 Mathematics For Machine TechnologyAdvanced MathISBN:9781337798310Author:Peterson, John.Publisher:Cengage Learning,
 Trigonometry (MindTap Course List)TrigonometryISBN:9781337278461Author:Ron LarsonPublisher:Cengage Learning
 Trigonometry (MindTap Course List)TrigonometryISBN:9781305652224Author:Charles P. McKeague, Mark D. TurnerPublisher:Cengage Learning